
Tall, Vertical Instrumentation Piping in Central Utility Plants
Miles Ryan, P.E., writes a monthly column in Engineered Systems Magazine on Building Commissioning. Read June’s column below:
Central utility plants often have much higher ceilings than you see in a typical mechanical room. Accordingly, central plant piping is often suspended much higher above the floor as well. Instrumentation used for measuring pressures in such system piping is often located closer to floor level to allow for easier access for maintenance or visual inspection. This means there are long lengths of vertical piping connecting that instrument to the system piping high above. Such long lengths of vertical piping may skew readings if the fluid in the pipe is different than one is antici pating. This article shares two recent case studies from central plants which initially caused me some confusion.
Case Study #1 Steam Header Pressure
A large central steam plant served a new hospital and also maintained the ability to back feed into the city’s district steam system. 130-pound steam was produced and available in the large steam supply header within the plant, which traversed the plant about 25 ft above the floor. There were numerous instrumentation devices used to confirm steam pressure in the plant.
- Each of the three boilers provided output steam pressure readings on their local control panel display.
- There were several sensors at various locations along the 130-pound steam supply pipe that were tied into the building automation system as well.
- There were a handful of local pressure gauges on the supply header that could be read from the mezzanine within the plant.
The commissioning of the plant was very intensive; 3 consecutive days of putting the system through all its paces. It was actually a very successful testing experience; the construction team had done a great job. Throughout the testing, all the aforementioned instrumentation read a steam supply pressure nearly exactly where it should have been in all the various scenarios we subjected the plant to. However, there was one pressure gauge that consistently read about 9 pounds higher than the rest. It was the large, centerpiece gauge located at the entrance to the plant operator’s office. This was the pressure reading that would arguably be observed by the operators more often than all other readings. I was eyeing that gauge throughout the testing, but kept my mouth shut as we were constantly working through items of far greater significance that demanded my immediate attention. Finally, the plant’s startup technician who was demonstrating the system for me caught me staring at the gauge a bit confused. He quickly enlightened me as to why the pressure gauge was reading high. The roughly 20 ft of instrumentation piping leading from the steam supply header down the gauge would not be maintaining low density steam in it, rather all such steam which entered that piping would eventually condense. This meant there was 20 ft of water column raising the pressure reading at the gauge about 9 psi higher than what the steam pressure was in the header above (see Figure 1). He also informed me there is a way to calibrate such gauges to account for that water column and such instructions should be easy to track down. However, since this was an owner-furnished gauge, added late in the project, the construction team insisted it was the owner’s responsibility to calibrate the gauge.
After he was unable to track down the calibration instructions, the boiler plant operator opted to just bend the needle on the gauge to the left by about 9 psi. I am a firm believer in doing things the right way, but I could not help but admire his ingenuity which resulted in the exact same outcome.
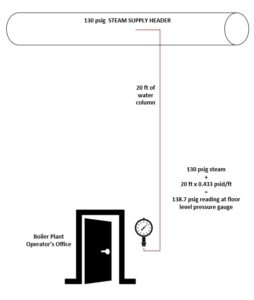
Figure 1: Pressure gauge mounted 20 ft below steam supply header.
Case Study #2 Differential Pressure Across a Chilled Water System’s Decoupler
At a separate central utility plant, also serving a new hospital, there was a variable speed primary/variable speed secondary chilled water system. Secondary pumps controlled to the differential pressure measured out in the distribution system to ensure adequate chilled water flow for the served loads. The primary pumps modulated to maintain a small positive flow in the decoupler (i.e. from the supply piping to the return piping). This approach allowed for primary pump energy savings to be realized during periods of low secondary flow and also ensured the secondary supply temperature matched that of the primary supply temperature (see Figure 2).
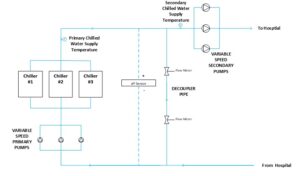
Figure 2: Variable speed primary/variable speed secondary chilled water system schematic.
Positive flow through the decoupler was to be measured and controlled for by a variety of means. First there were two flow meters in the decoupler pipe. The average of their readings was to be used as the control point. The primary pumps were to control it to a setpoint of 100 GPM. Should any meter fail, it would be taken out of the logic and only the operational meter would be used for control. Should both flow meters fail, the differential pressure sensor across the decoupler would be used to control to a 2 psid setpoint.
During the functional testing on the plant, we were seeing some very odd behavior from both the flow meters in the decoupler. As the primary pumps slowed down, the measured flow from the supply piping to the return piping through the decoupler unexpectedly increased. We suspected the flow meters were reading backwards, which was eventually confirmed. However, that troubleshooting process was further complicated by the fact the differential pressure sensor was also reading a positive value, indicting flow in the correct direction. As it turned out, there was a substantial amount of air in the vertical instrumentation piping that ran from the supply and return piping, about 20 ft in the air, down to the differential pressure sensor mounted on the wall down at the floor level. And there was several more feet of air column in the pipe leading from the return piping to the low-pressure side of the differential pressure sensor. This resulted in consistently positive readings from the sensor, even when all system pumps were disabled (when it should have read 0 psid) and when just the primary pumps were disabled (when it should have read negative). See Figure 3 for a deeper explanation of the effect air had on this sensor’s reading.
Air was bled out of those vertical stretches of instrumentation piping and automatic air vents were installed at the top of them to ensure we didn’t find ourselves in that situation again.
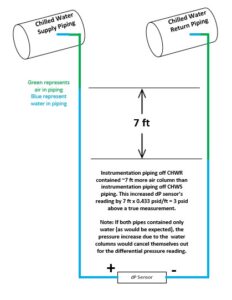
Figure 3: The impact of air in vertical instrument piping on a differential pressure sensor’s reading.
Conclusion
The higher the column of fluid, the higher the pressure that will be realized at the bottom of the column. Some fluids (e.g. air or steam) have low enough density that that pressure associated with 20 ft of vertical piping can be neglected. But the weight of water cannot. Case study #1 demonstrated how a column of water within piping connecting a pressure gauge to the steam header, threw off the pressure readings and needed to be accounted for. Case study #2 demonstrated how the presence of air in differing amounts between the two vertical pipes leading to a differential pressure sensor resulted in skewed readings as well.
A relatively easy concept to understand, but equally easy to overlook when you are fixated on learning the complex systems that are often present in central utility plants.